Obfuscation_Techniques
Recently I was watching GynvaelEN’s Old Stream about ELF Packers, and I thought why not make a PE Packer. I decided that I will write a python script to Parse PE Headers from scratch, I was able to parse some headers and then I got stuck and decided that I will use PEFILE.
──────▄▌▐▀▀▀▀▀▀▀▀▀▀▀▀▀▀▀▀▀▀▀▌
───▄▄██▌█ BEEP BEEP
▄▄▄▌▐██▌█ POOR SCRIPT AHEAD
███████▌█▄▄▄▄▄▄▄▄▄▄▄▄▄▄▄▄▄▄▄▌
▀(@)▀▀▀▀▀▀▀(@)(@)▀▀▀▀▀▀▀▀(@)▀
so I made a poor packer which is available here packer.
Keep in mind it only works for some 32bit Windows Executables.
Now the question comes that what are some anti-debugging techniques in windows like we have in Linux.
I looked around on the internet and found some techniques. I will keep updating this post as I find more techniques
Windows
1. BeingDebugged in PEB:
 1struct _PEB {
 2    0x000 BYTE InheritedAddressSpace;
 3    0x001 BYTE ReadImageFileExecOptions;
 4    0x002 BYTE BeingDebugged; // fs:[0x30]
 5    /*
 6    ..... .... ..............
 7    ..... .... ..............
 8    ..... .... ..............
 9    ..... .... ..............
10    */
11    0x204 void* SystemAssemblyStorageMap;
12    0x208 DWORD MinimumStackCommit;
13};
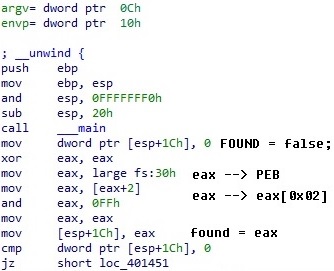
you can access the Process Environment Block in assembly using “fs”. the following inline assembly code fetches the value of BeingDebugged
 1/* MINGW add -masm=intel while compiling */
 2BOOL found = FALSE;
 3__asm__(
 4	"xor eax, eax\n"
 5	"mov eax, fs:[0x30]\n"
 6	"mov eax, [eax + 0x02]\n"
 7	"and eax, 0x000000FF\n"
 8	"mov %0, eax\n" :"=r" (found)
 9);
10if(found){
11	printf("YES\n");
12} else {
13	printf("NO\n");
14}
 1/* VISUALC++ */
 2BOOL found = FALSE;
 3_asm
 4{
 5	xor eax, eax; 			// clear eax
 6	mov eax, fs:[0x30]; 	// Reference start of the PEB
 7	mov eax, [eax + 0x02]; 	// PEB+2 points to BeingDebugged
 8	and eax, 0x000000FF; 	// only reference one byte
 9	mov found, eax; 		// Copy BeingDebugged into 'found'
10}
11if(found){
12	printf("YES\n");
13} else {
14	printf("NO\n");
15}
2. Detecting Breakpoints :
 1/* VISUALC++ */
 2void detect_breakpoint() {
 3	BOOL found = TRUE;
 4	__try {
 5		_asm {
 6			int 3; // \xCC
 7		}
 8	}
 9	__except (EXCEPTION_EXECUTE_HANDLER) {
10		found = FALSE;
11	}
12	if (found) {
13		printf("NO DEBUGGING\n");
14	} else {
15		printf("GOOD\n");
16	}
17}
3. Erase PE Headers From Memory:
This trick helps in ruining any attempt of dumping unpacked binary from memory
 1// from AntiRE.h
 2inline void ErasePEHeaderFromMemory()
 3{
 4	DWORD OldProtect = 0;
 5
 6	// Get base address of module
 7	char *pBaseAddr = (char*)GetModuleHandle(NULL);
 8
 9	// Change memory protection
10	VirtualProtect(pBaseAddr, 4096, // Assume x86 page size
11			PAGE_READWRITE, &OldProtect);
12
13	// Erase the header
14	ZeroMemory(pBaseAddr, 4096);
15}
4. OutputDebugString() :
CheckOutputDebugString checks whether OutputDebugString causes an error to occur or not .if the error does occur then we know there’s no debugger, otherwise if there IS a debugger no error will occur
1inline bool CheckOutputDebugString(LPCTSTR String)
2{
3	OutputDebugString(String);
4	if (GetLastError() == 0)
5		return true;
6	else
7		return false;
8}
LINUX
- Ptrace :
 1/* trying-to-make-your-binary-shut-up.txt : https://www.exploit-db.com/raw/13188 */
 2#include <stdio.h>
 3#include <sys/ptrace.h>
 4
 5void main(void)
 6{
 7 FILE *fd;
 8 if (ptrace(PTRACE_TRACEME, 0, 1, 0) == -1)
 9 {
10   printf("so you wanna trace me?...\n");
11   return(-1);
12 }
13
14 fd = fopen("/etc/passwd", "r");
15 if(fd == NULL) return;
16 else printf("file opend\n");
17 exit(-1);
18}
2. You Tell :
Your comment is under review. Thanks!